baselinr builds report-ready baseline equivalence tables for impact evaluations in education research, following the conventions of the What Works Clearinghouse (WWC). Given a treatment indicator and a set of covariates, it reports the appropriate standardized effect size for each covariate, Hedges’ g for continuous covariates and the Cox index for binary ones, together with the WWC equivalence category.
It is a thin, education-specific reporting layer. For general-purpose covariate balance assessment, see cobalt; baselinr focuses narrowly on the WWC equivalence categories that education evaluation reports are required to state.
Installation
Install the released version from CRAN:
install.packages("baselinr")Or the development version from GitHub:
# install.packages("remotes")
remotes::install_github("zl1212-ship-it/baselinr")
Example
library(baselinr)

study <- data.frame(
  treat   = c(1, 1, 1, 0, 0, 0),
  pretest = c(5, 6, 7, 4, 5, 6), # continuous -> Hedges' g
  female  = c(1, 0, 1, 0, 0, 1)  # binary     -> Cox index
)

knitr::kable(baseline_equivalence(study, treatment = "treat"), digits = 3)| covariate | type | n_treatment | n_comparison | mean_treatment | mean_comparison | sd_treatment | sd_comparison | effect_size | wwc_category |
|---|---|---|---|---|---|---|---|---|---|
| pretest | continuous | 3 | 3 | 6.000 | 5.000 | 1.000 | 1.000 | 0.80 | not_satisfied |
| female | binary | 3 | 3 | 0.667 | 0.333 | 0.577 | 0.577 | 0.84 | not_satisfied |
The WWC categories are:
| Effect size (absolute) | Category | Meaning |
|---|---|---|
<= 0.05 |
satisfied |
Baseline equivalence holds. |
0.05–0.25
|
satisfied_with_adjustment |
Holds only if the covariate is adjusted for in the impact model. |
> 0.25 |
not_satisfied |
Cannot establish equivalence. |
Visualise and format
love_plot() shows the standardized effect size of every covariate against the WWC thresholds (requires ggplot2):
love_plot(baseline_equivalence(study, treatment = "treat"))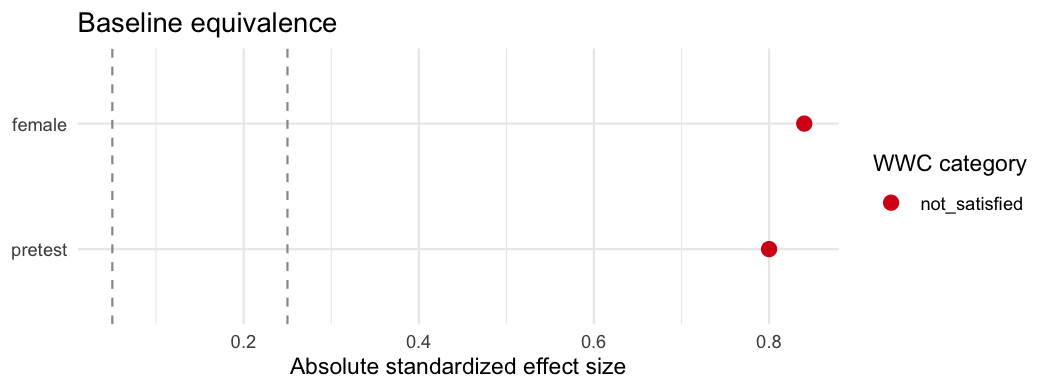
gt_baseline() renders the same table as a formatted gt table for reports and Quarto/HTML (requires gt):
gt_baseline(baseline_equivalence(study, treatment = "treat"))Scope
Continuous covariates use Hedges’ g (with the WWC small-sample correction); binary covariates (numeric 0/1, logical, or two-level factor) use the WWC Cox index. wwc_summary() collapses the table into an overall verdict, and attrition() reports overall and differential attrition. See NEWS.md for the roadmap.