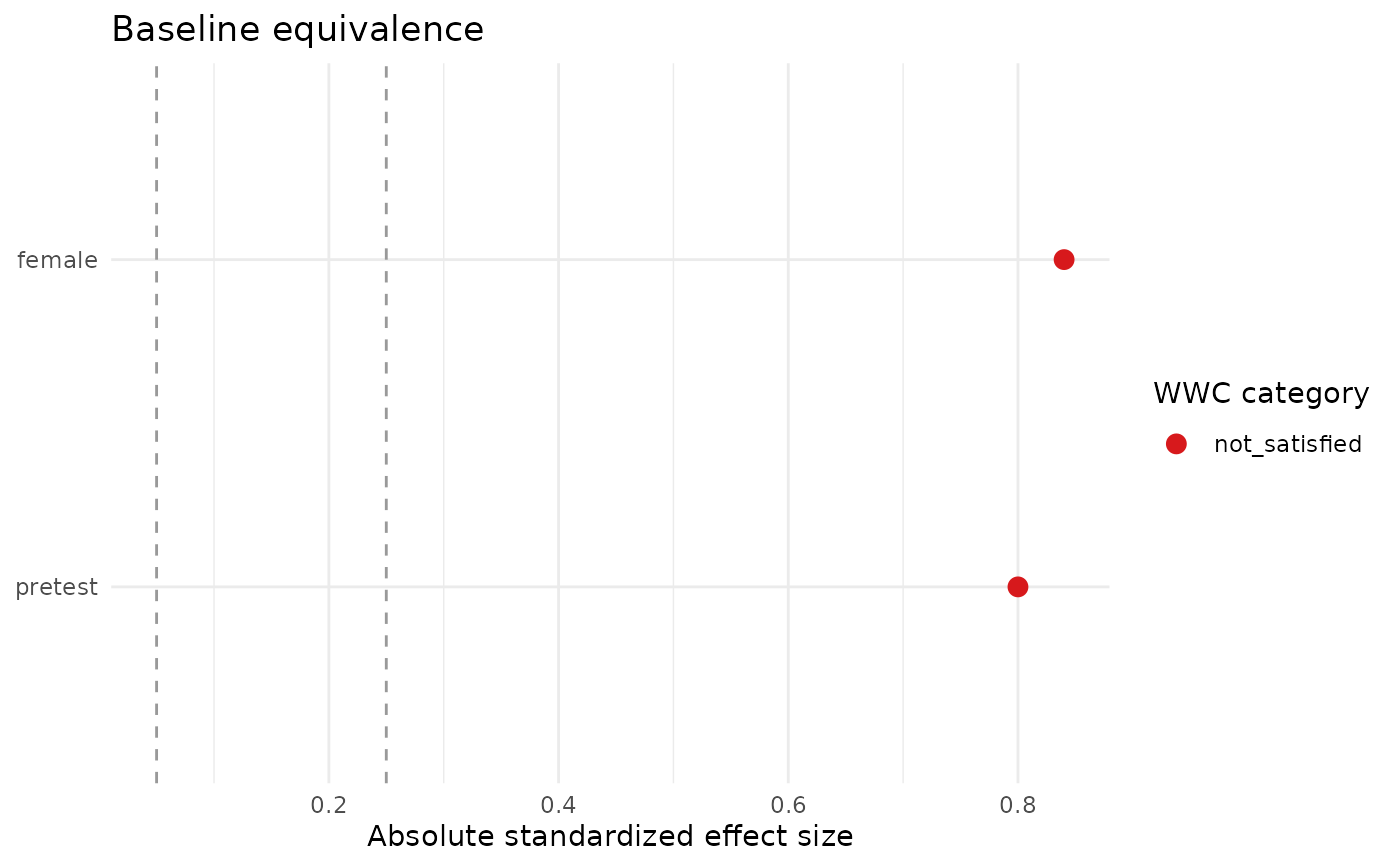
Plots the standardized effect size for each covariate from
baseline_equivalence(), with reference lines at the What Works
Clearinghouse (WWC) thresholds (0.05 and 0.25) and points coloured by WWC
category. Requires the ggplot2 package.
Arguments
- equivalence
A data frame returned by
baseline_equivalence().- signed
Logical. If
FALSE(default), plot absolute effect sizes with reference lines at 0.05 and 0.25. IfTRUE, plot signed effect sizes with symmetric reference lines and a line at zero.
Examples
if (requireNamespace("ggplot2", quietly = TRUE)) {
  df <- data.frame(
    treat = c(1, 1, 1, 0, 0, 0),
    pretest = c(5, 6, 7, 4, 5, 6),
    female = c(1, 0, 1, 0, 0, 1)
  )
  love_plot(baseline_equivalence(df, "treat"))
}