Before you compare two groups’ survey scores, check this
Here’s a sentence that should make you flinch: “Group A scored higher on the belonging scale, so Group A feels more like they belong.”
I have a soft spot for this trap, mostly because I’ve walked into it myself. It sounds airtight. Five items, two groups, one mean is higher, write it up. But there’s a premise buried in there that nobody says out loud, and the whole conclusion is sitting on top of it.
The premise is that the scale means the same thing to both groups.
The lens thing
I think of a scale as a lens you look at a construct through. Comparing two groups’ scores assumes they’re looking through the same lens. If the lenses are ground differently, then comparing what each group “sees” tells you about the lenses, not the thing you were trying to look at. The technical name for “same lens” is measurement invariance, and it is not a given. It’s a thing you check.
How much you’re allowed to say
Invariance comes in levels, and each one buys you a different comparison. Roughly: if the same items load on the same factor in both groups (configural), you’ve got the basic shape. If the loadings are equal too (metric), you can start comparing relationships across groups. And only if the intercepts are also equal (scalar) are you actually allowed to compare means.
That last one is the level your group comparison quietly assumed it had. You test for it with a multigroup CFA. And when a single item behaves differently across groups, that’s DIF, differential item functioning, which is a fancy way of saying the lens has a chip in it right there.
Watch it happen
Two groups, a 5-item engagement scale, and here’s the thing: I built them to have identical true engagement. Same distribution, no real difference. Then I made one item (item 5) read systematically lower for group B at the same level of engagement. Textbook DIF. Then I just… compared the groups, the way anyone would, with a standardized mean difference:
library(baselinr)
hedges_g(theta, group)        # the true latent difference
hedges_g(scale_full, group)   # observed, all 5 items
hedges_g(scale_inv, group) # observed, dropping the one DIF item| What’s compared | Hedges’ g |
|---|---|
| True latent engagement | −0.03 (there is no real difference) |
| Observed 5-item scale | −0.25 |
| Scale without the DIF item | −0.02 |
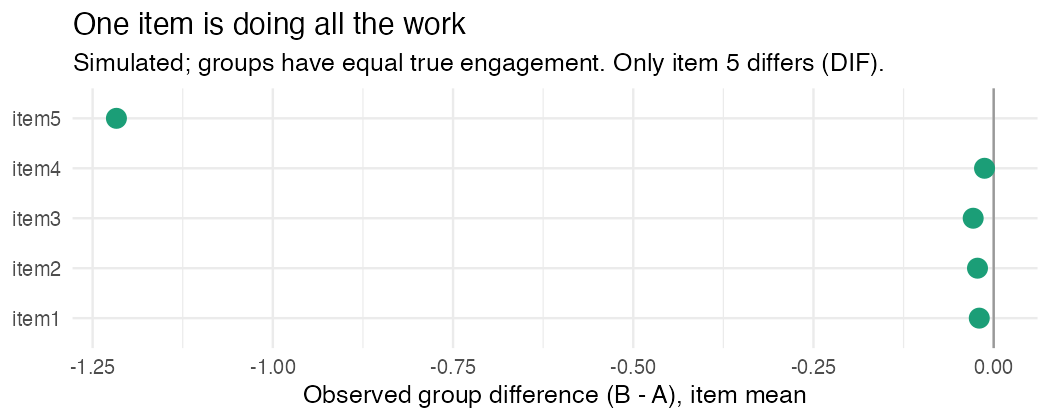
The groups are equal. I promise, I made them that way. And the full scale still reports g = −0.25, which most people would write up as “Group B is less engaged.” The figure shows the crime scene: items 1 through 4 are flat, and item 5 is doing all of the work, off by −1.22 on its own. Pull that one item and the difference evaporates to −0.02.
Nothing about engagement happened here. The ruler happened.
What to do
Test invariance before you compare means, every time you’re comparing a latent thing across groups. If it fails, don’t throw the whole comparison out, go find the items that broke (the DIF ones). And then report partial invariance honestly, anchored on the items that held. It’s less clean than a single triumphant p value. It’s also the difference between a finding about students and a finding about your questionnaire.
Measurement is the thing I get genuinely nerdy about. I build baselinr and I’m building a cohort course on credible evaluation and measurement in education. subscribe via RSS if you want in.