I ranked the same eight universities two defensible ways. The list nearly reversed.
I keep telling people that a school rating depends on the weights inside the formula, and I realized recently that I had never actually watched it happen with numbers I could check. So I built the smallest real ranking I could.
I took the eight public four-year universities in Washington, where I studied, and two numbers per school from the 2021 federal IPEDS collection. The first is the six-year graduation rate for bachelor’s students: of those who start, how many finish. The second is Pell share: what fraction of undergraduates receive a federal Pell grant, a rough marker of how many lower-income students a campus serves. Neither number is obscure and neither is controversial to care about. A public university is supposed to graduate its students, and it is supposed to be open to students without money.
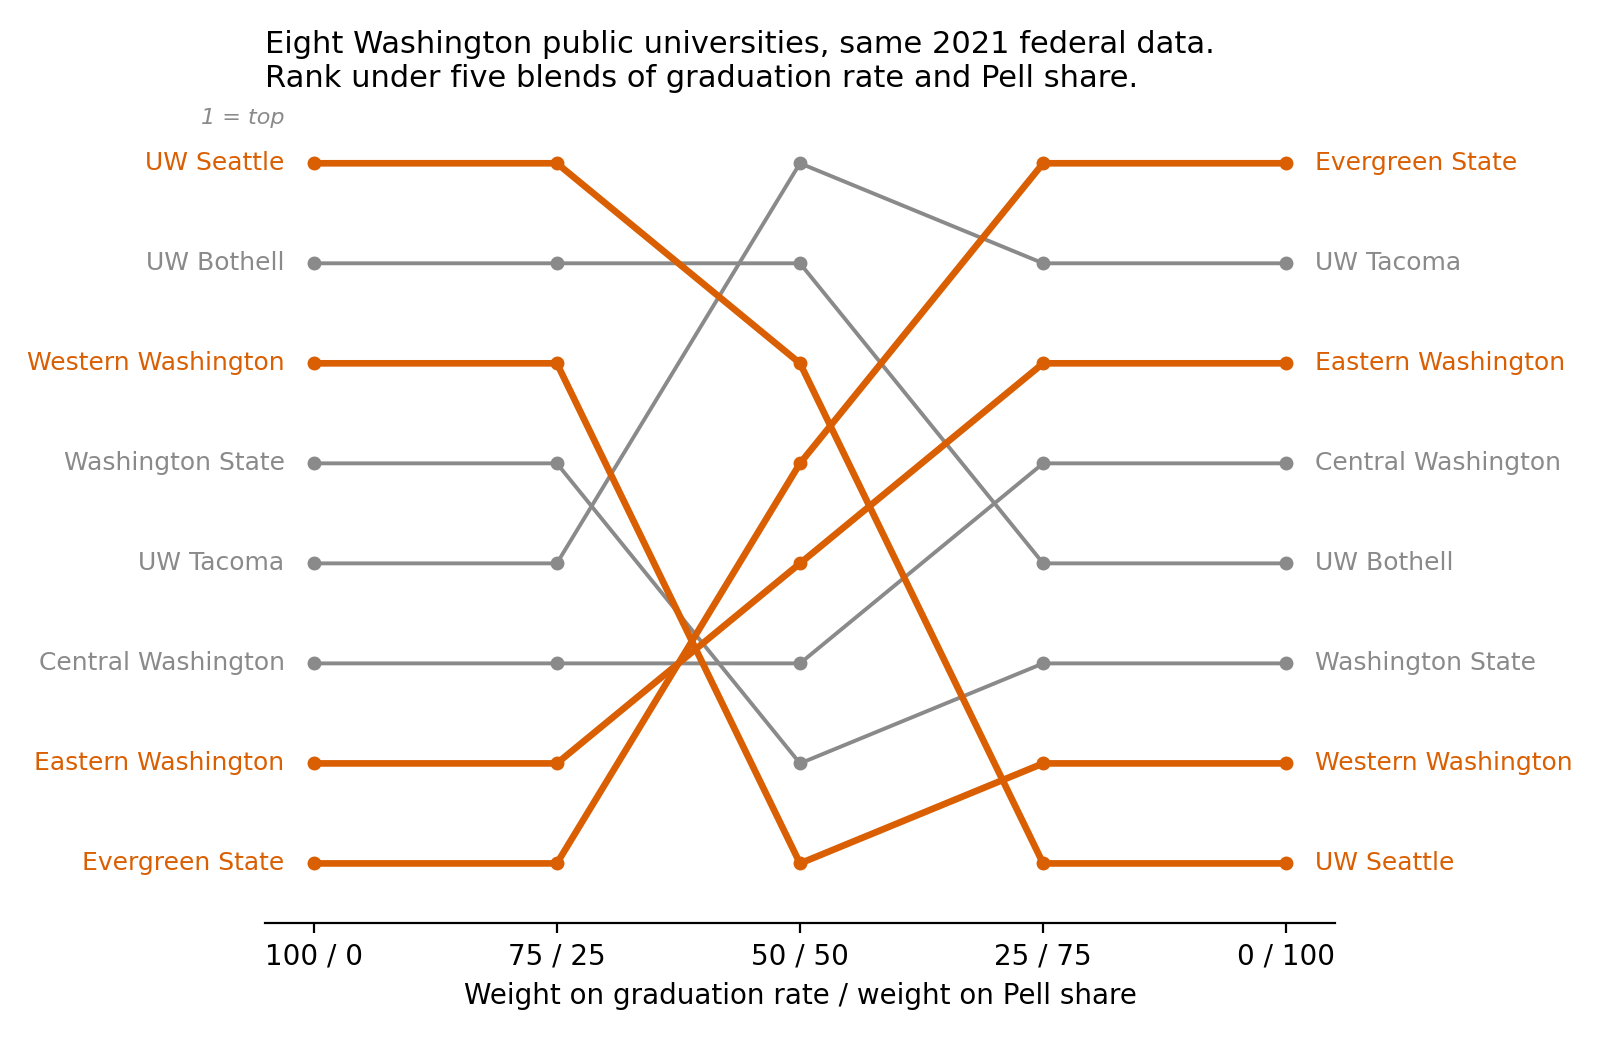
Then I did what every rating system does. I put the two on a common scale, blended them with a weight, and ranked. The only thing I varied was the weight, in five steps from all-graduation to all-Pell.
What surprised me
I expected some reshuffling in the middle. I did not expect the list to nearly turn over. UW Seattle is first when the weight is on graduation (84% of its students finish, the highest here) and last when the weight is on Pell share (17% of its undergraduates receive Pell, the lowest here). Evergreen State is the exact mirror: last on one end, first on the other. These aren’t two rankings of quality and its absence. They are two different questions, and each school answers one of them well.
The reason the reversal is so clean is worth stating: in this group of eight, the two measures are strongly negatively related. The campuses that graduate the largest share of students enroll the smallest share of Pell students. I don’t get to conclude much from eight schools about why that is, but it has an uncomfortable implication for anyone building a rating: there is no weight between these two numbers that is neutral. Every blend takes a side, quietly.
What this little exercise can’t say
A lot, honestly. Two indicators is a cartoon; real rating systems use many, and better ones. A graduation rate reflects who enrolls at least as much as what a campus does for them. Pell share is a coarse stand-in for access. And my choices leaked in everywhere: I checked the endpoints of the figure under two other reasonable ways of scaling the numbers and they came out the same, but the 50/50 column did not. Even the scaling is a decision.
Above all, this is not a ranking of Washington’s universities, and none of these schools is “worst.” That is closer to being the point: any single ordered list of them would be hiding a judgment call in the weights.
What I do differently now
When I see a composite rating, I try to find two things before reacting to any school’s position: what is weighted how much, and whether the publisher shows how the order moves under other defensible weightings. When that sensitivity is reported, I trust the list more, not less.
I’m working on audits of real rating and flagging systems with public data, and I’ll write them up here as they become shareable.
Update, October 2026: the first of these is out. If colleges were employers, two-thirds of those we can audit would fail the government’s own fairness test.
The data (a small CSV pulled from the Urban Institute’s public IPEDS API) and the figure script (make_figure.py) are in this post’s folder; deleting the CSV and rerunning the script re-fetches the numbers.
Related: What a “teacher effectiveness” score actually measures (and what it doesn’t). I build baselinr and am developing a cohort course on credible evaluation and measurement in education. subscribe via RSS to follow along.